A hands-on project with dbt, Streamlit, and PostgreSQL

This blog was written together with Arbin Bici.
If you are part of the tech community, the probability that you have, at least once, dealt with databases and SQL is high. So, we can relate to, among others, the following issues:
- Did I commit this transaction?
- My data is duplicated, and I don't know how to sanitize it.
- I have no documentation for this project. Let me reverse engineer the ELT every time I need to change something.
It often occurs that we also make mistakes whilst dealing with these issues, in which case we need someone to double-check the outcome. This type of work usually falls within the scope of the Analytics Engineer's duties who uses dbt or similar tools to boost productivity.
What is dbt?
dbt is an acronym for Data Build Tool, specialized in the transformation (T) part of an ELT process. Hence, with dbt, you transform the warehouse data that is already loaded and shape it the way you want by using classic select statements.
What makes dbt so useful?
dbt materializes queries as relations so that you do not need to worry about the DDL. This way you can focus only on defining models (SQL queries) that transform the data as needed to meet the business requirements. It also offers the power of software programming with Jinja templates.
Developing locally
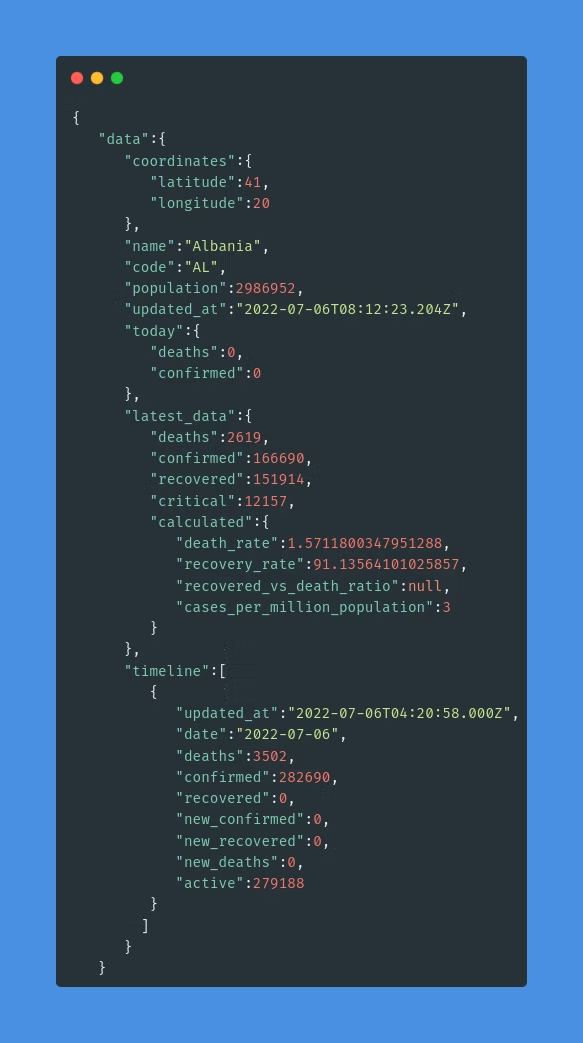
Let's assume that we are interested in some information regarding Covid in the past two years. For this, we have a source API that provides data, which is not entirely meaningful at first sight.
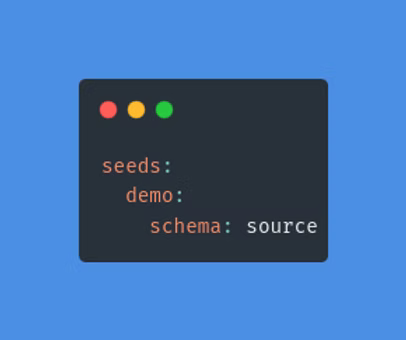
The profile.yml file holds the configuration of the database connection, where it is stated that all tables generated by this command are to be created on the source schema in the Postgres database.
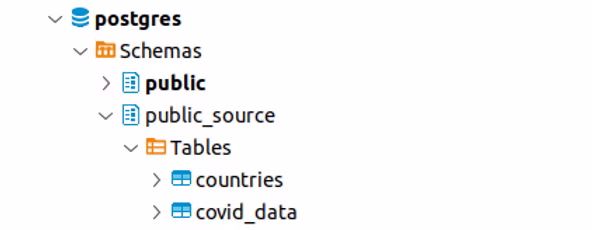
After seeding, you should have this view on your database instance:
These two tables are going to be our source. To tell dbt this fact, we create a src_covid_data.yml configuration file in the structure below:
Once defined as a source, these tables can be referred to within the project as shown in the following Jinja function:
{{ source('source', 'covid_data') }}Prepare source data
Now that we have a source, we will do some transformations to demonstrate the power of dbt. For this use case, we aggregated the records to show for each country the total daily number of people infected, recovered, and deceased. We create a SQL file called stg_prepared_source, under the staging folder. This model queries the source and aggregates the data to the desired response.
In order to check what is the actual query that runs in the database, you can compile the query using the following command:
dbt compile --profiles-dir ./profilesLook under the targets to see the SQL queries generated by dbt.
Execute the following to create all models:
dbt run --profiles-dir ./profilesTo only run this model, execute the following command:
dbt run --select stg_prepared_source --profiles-dir ./profilesNote: We have configured in the dbt_project.yml that all models under the staging folder will be materialized as views. Expect to see a view object named stg_prepared_source in the public schema of the database. However, this configuration can be overridden in the models' file by adding:
{{ config(materialized = 'table') }}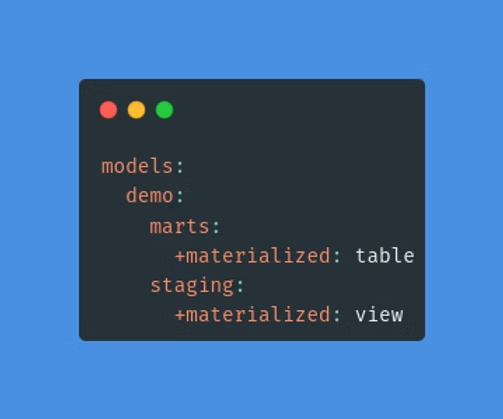
The second staging model, stg_deaths_per_month, aggregates the number of deaths per month in each country. We have used an incremental model to only process the latest data for this one. A model can be created to have a view, table, ephemeral or incremental materialization.
All materializations are built, if not existent, every time the dbt run command is executed. This results in re-processing the same records repeatedly.
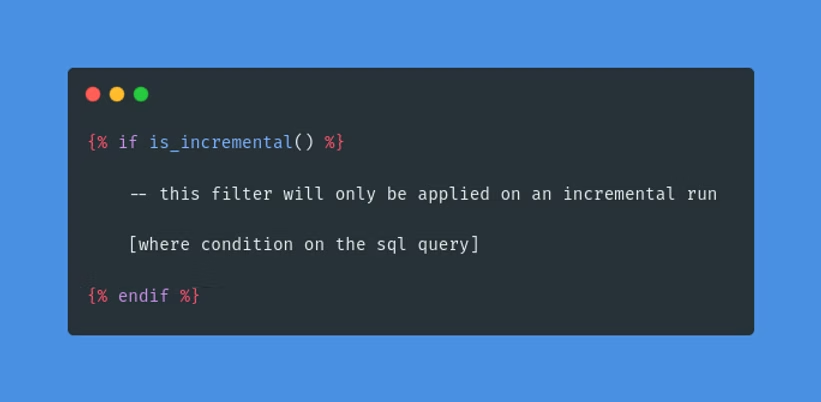
To process only new data, use the incremental materialization type and define the filtering rule accordingly. This means that only the data that fits the "where" condition will be inserted or updated in the model.
To surpass this condition and refresh the whole model execute the following command:
dbt run --full-refresh --profiles-dir ./profilesCalculate the death rate
The main purpose of this project was to find the death rate during the pandemic. We know that the formula for this is the following:
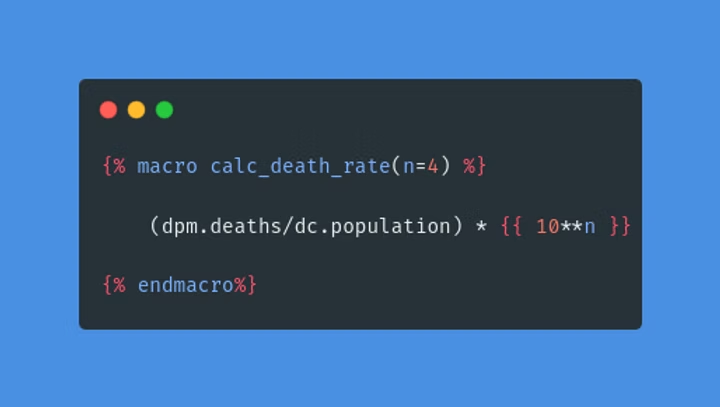
death_rate = deaths / population * 100To calculate the death rate, we have built a macro called calc_death_rate(n), where n is the number of zeros used in the scale.
Macros are functions that are either defined by the developer inside the macros folder or part of a package that is imported. For the most common functionalities, there are predefined macros that can be imported with packages. Inside the project, there is a packages.yml file where we have listed the packages we want to install.
To install these packages, execute:
dbt depsMacros are then called inside Jinja template tags. Under the marts folder, there is the monthly_death_rate.sql model which in its third column has the calc_death_rate(n) macro that takes n as the number of people and returns the death rate per n people.
A macro is executed automatically if it is called by another object. To run a macro independently:
In this case, the macro will be called by the model and the model will be created with the run command:
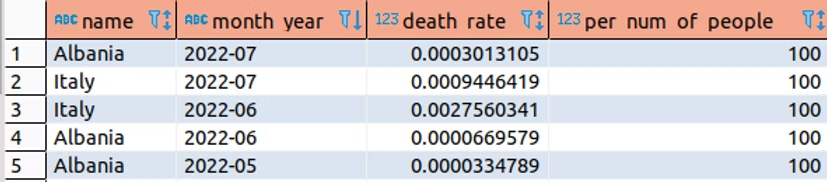
dbt run --profiles-dir ./profilesAt this point, the fct_monthly_death_rate table looks as shown below:
Analyses
There may be cases where you just need to save the query but not materialize it. For this purpose, you can save the SQL file under the analyses folder. These files will be compiled but not executed. This way they will be stored and versioned like other dbt objects. To compile one, run:
dbt compile --profiles-dir ./profilesTests
Tests are SQL queries applied to the data to check for logical mistakes. There are two types:
- Singular — built-in tests assigned to columns in configuration YAML files.
- Generic — custom tests defined as SQL files under the tests folder.
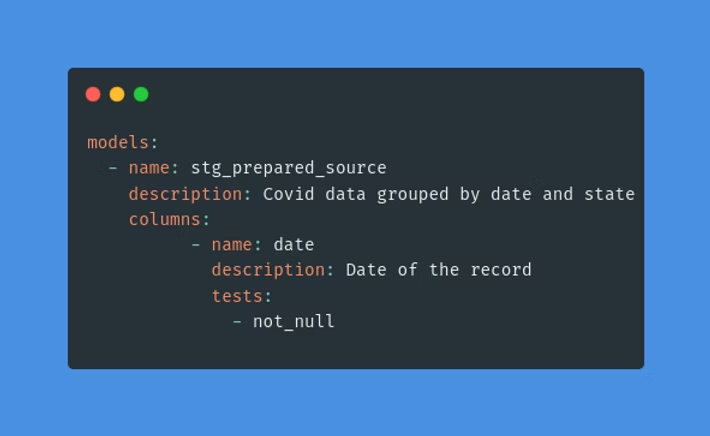
Singular tests are used inside the configuration yaml files. They must be assigned to a column to run.
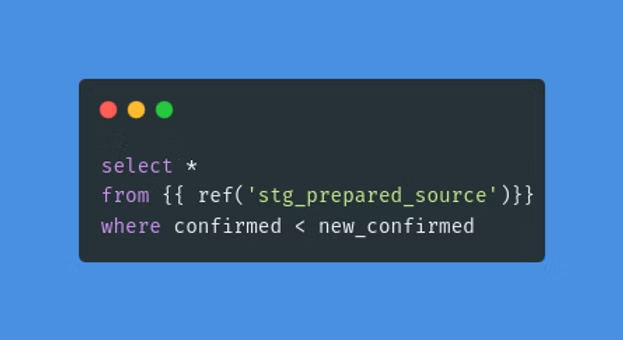
Generic tests are defined as SQL files under the tests folder. If for any reason a generic test query returns values, the test is said to have failed.
Run all tests:
dbt test --profiles-dir ./profilesRun singular tests:
dbt test --select test_type:singularRun generic tests:
dbt test --select test_type:genericDocuments
dbt offers a way of documenting your project with descriptions and relations configured in the yaml files.
To create and version the documentation:
dbt docs generate --profiles-dir ./profilesTo view it locally on port 8000:
dbt docs serve --profiles-dir ./profiles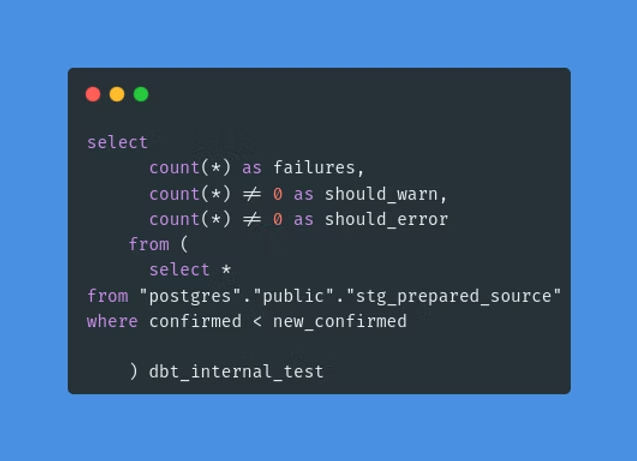
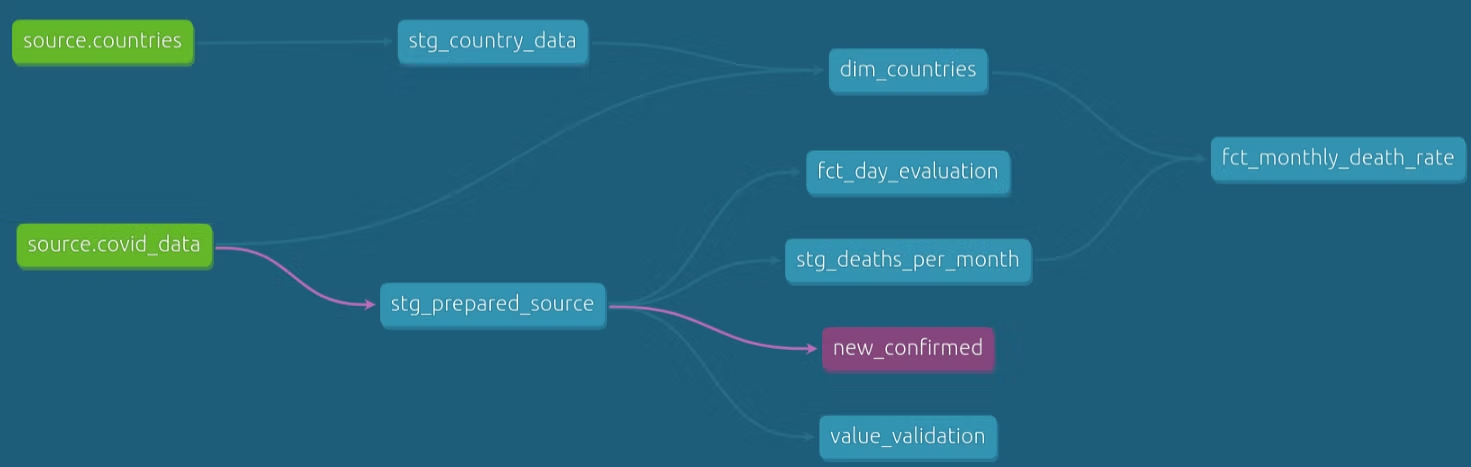
A blue circle button in the bottom right corner will show a visualization of the data flow and dependencies between database objects — the DAG (directed acyclic graph):
Streamlit Integration
Streamlit is an open-source framework, used to turn data scripts into shareable web applications with just a few lines of Python code. It visualizes all the data or ML models you want. In our case, we used it to show the process of dbt creating its models displaying the data as a Pandas Dataframe. We also used an Altair Chart that shows the number of deaths for each country selected for every month since January of 2020.
Since the whole application is dockerized, we can use only the following command (while in the demo folder) to start both the Streamlit app and the PostgreSQL database:
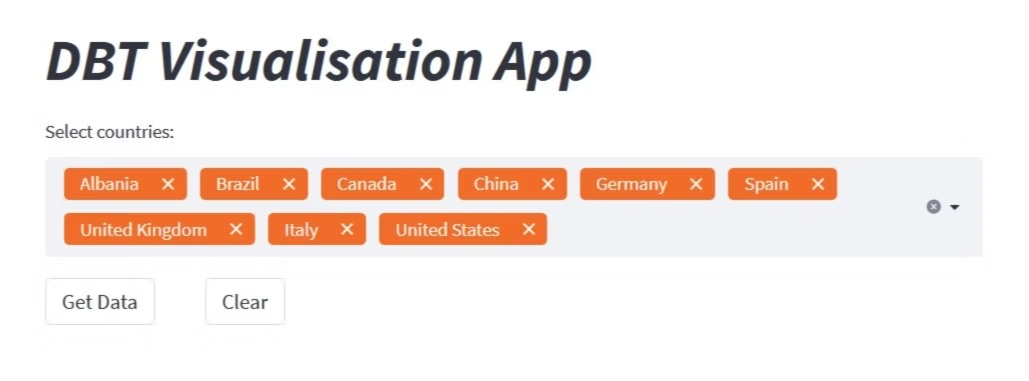
docker compose up --buildNow we can go to localhost:8501. Select all the countries you want and click on Get Data. The output should look as follows:
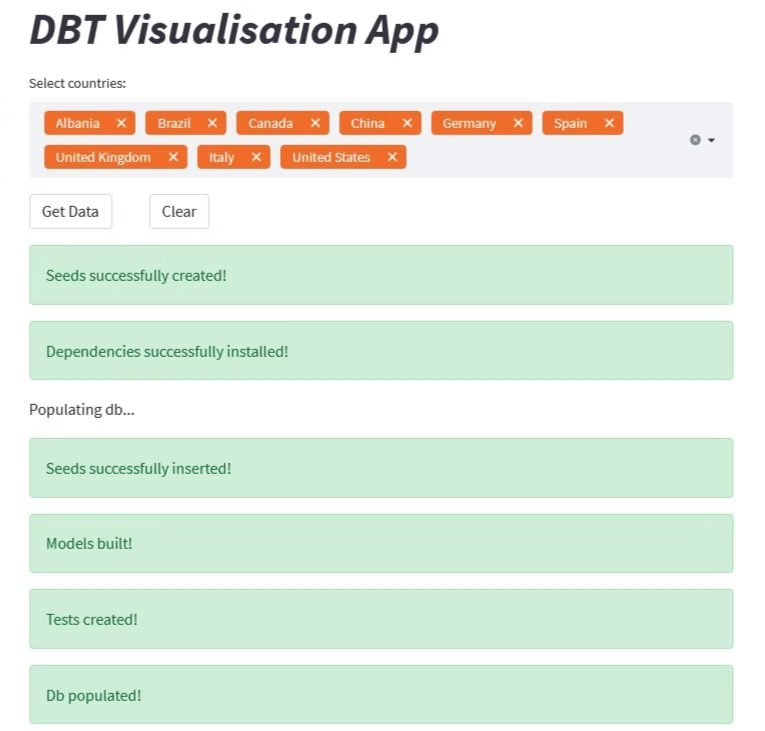
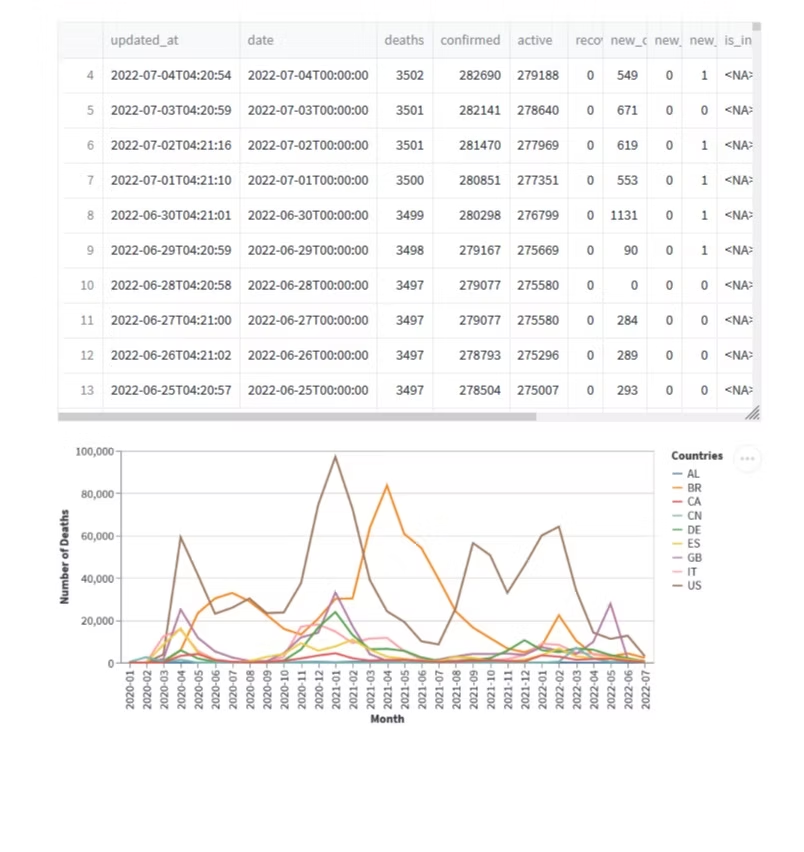
At this point, we can see the dataframe that shows all the information we get from the API for each country, and then the graph that shows the number of deaths for each month of every selected country.
You can clear the output by clicking the clear button, or clear the selected countries plus the output by pressing the small cross sign in the selection box. When finished, stop the docker containers using:
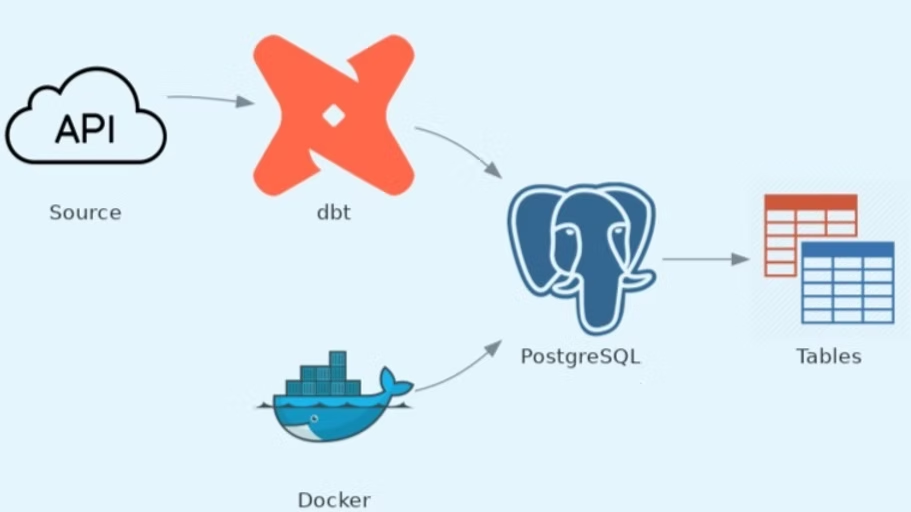
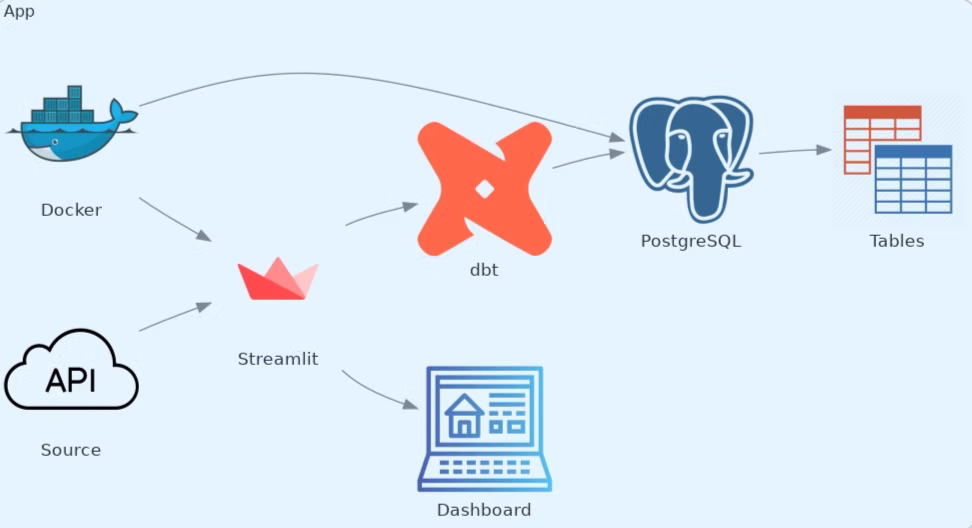
docker compose downThe following diagram shows the architecture of the whole app:
Summary
In this demo, we were able to turn a simple dataset with Covid-related data into a line graph that provides information on how many deaths per month have occurred in each chosen country. We went from a CSV to multiple staging and target models of different materializations, analysis, macros, tests, and documentation, all within one dbt project.
Once properly configured, dbt can:
- Determine the order in which the staging and target tables should be created
- Generate the DDL to build the database objects
- Keep track of documentation and serve a good-looking graph that shows the data flow
- Run automatic tests and snapshots
- Define and call functions
- Compile, run and generate SQL queries with Jinja template tags
Then we could visualize the entire process and output of dbt using Streamlit.
For any questions, feel free to reach out to us at hello@datamax.ai.

Bujar Bakiu
CTO at DataMax